US National Parks Visitor Data - Tableau
Visualization of National Park Visitor Data (Python, Tableau)
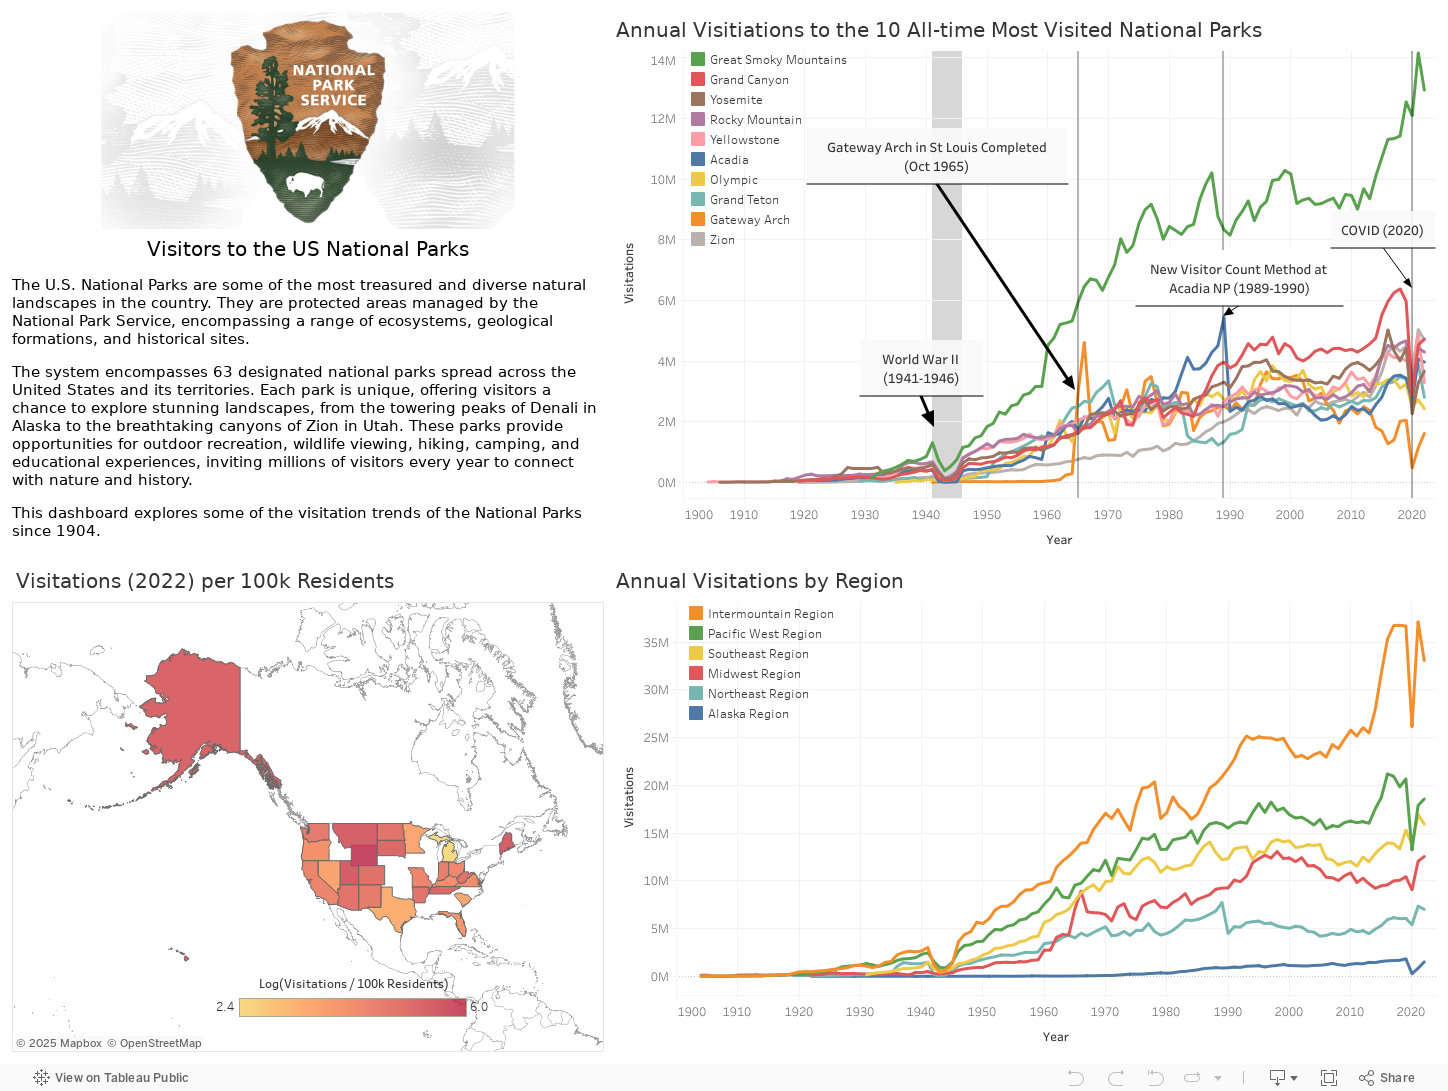
This project was a fairly straightforward analysis of National Park visitor data collected by the National Park Service. I performed some data manipultaion in python, then performed the data visualization in Tableau. Mainly I show the visitation timeline for the top all-time most visited parks, as well as visitiations relative to the state population. A few interesting points in the park visitation timelines are highlighted. Below is a static image version of the dashboard. The interactive Tableau dashboard is available on this Tableau Public Page.

Image of the Tableau dashboard visualizing visitor data to the US National Parks. For the interactive dashboard, visit the Tableau Public Page
<script type='text/javascript'> var divElement = document.getElementById('viz1700154831254'); var vizElement = divElement.getElementsByTagName('object')[0]; vizElement.style.width='1448px';vizElement.style.height='1091px'; var scriptElement = document.createElement('script'); scriptElement.src = 'https://public.tableau.com/javascripts/api/viz_v1.js'; vizElement.parentNode.insertBefore(scriptElement, vizElement); </script>