Supply Chain Analysis & Optimization - pt 1
Analysis of supply chain data (Supply chains, optimization, linear programming, Python, scipy PuLP)
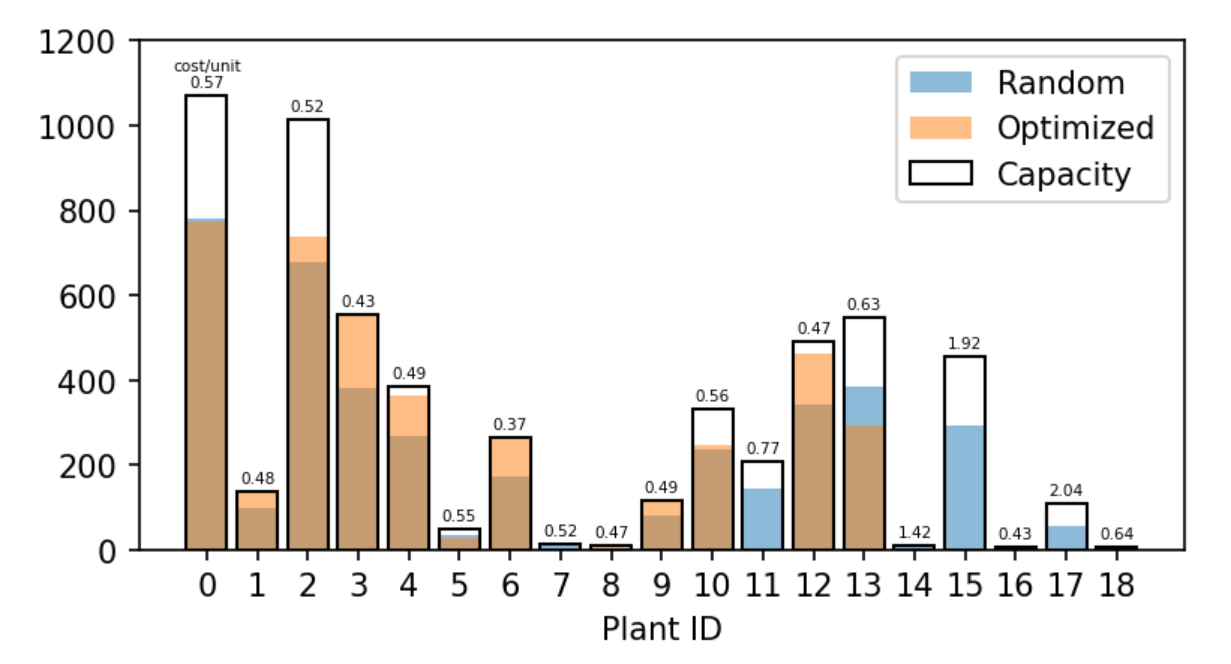
In this project I explore some supply chain logistics network data. I do some basic data viz in Tableau (see here) and then calculate the supply chain cost given the warehousing and transport costs of the network and the orders. I then create a very simple linear programming model to optimize the warehouse assignment. This is done using SciPy and PuLP in order to compare the two implementations. Overall the optimization yields a ~25% cost reduction compared to random warehouse assignment.
This was a very simplified analysis that I hope to follow up with a more complicated study that includes more of the complexities provided by the dataset. Here however I mainly wanted to play around with the various interconnected supply chain data tables, practice visualizing supply chain data, and perform basic supply chain optimization tasks.
